geomap
dawgdad/scripts/geomap.py
#! /usr/bin/env python3
"""
Simple example of using the geomap function.
"""
from shapely.geometry import Polygon, Point
import matplotlib.pyplot as plt
import geopandas as gp
import dawgdad as dd
def main():
"""
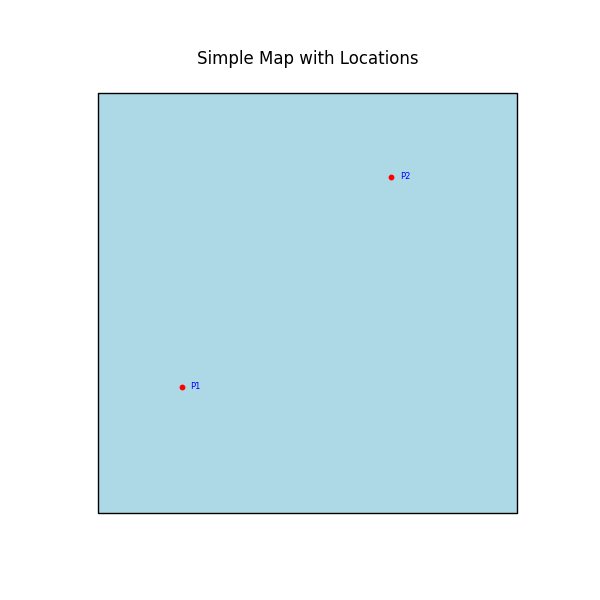
Creates a simple map with a polygon and plots some labeled locations on it.
The output is saved as an SVG file.
"""
# Create a simple map GeoDataFrame (a square)
map_data = {
"name": ["Region A"],
"geometry": [Polygon([(0, 0), (0, 1), (1, 1), (1, 0)])]
}
map_gdf = gp.GeoDataFrame(map_data, crs="EPSG:4326")
# Create a simple locations GeoDataFrame (two points with labels)
locations_data = {
"code": ["P1", "P2"],
"geometry": [Point(0.2, 0.3), Point(0.7, 0.8)]
}
locations_gdf = gp.GeoDataFrame(locations_data, crs="EPSG:4326")
# Use the geomap function to plot
ax = dd.geomap(
map_file=map_gdf,
locations_file=locations_gdf,
map_colour="lightblue",
edge_colour="black",
line_width=1,
marker_type="o",
marker_size=10,
point_colour="red",
text_colour="blue",
code=locations_gdf["code"].tolist(),
figsize=(6, 6),
)
# Set a title for the plot
ax.set_title("Simple Map with Locations")
# Save the plot as a pgn file
plt.savefig("geomap.png")
if __name__ == "__main__":
main()